You are in the middle of the Sprint, stories yet to be peer-reviewed, testers are waiting to go ahead and close off the Sprint. Life must go on! You need to keep going for the sake of the continuity of the project. And you decide to release a new build, accepting that business agnostic widget left in a core layer module.
Technical debt is inevitable and it needs to be tackled on a regular and consistent basis, from the very early phases.
According to a study conducted by Neil Ernst in 2015, at Carnegie Mellon University, A Field Study of Technical Debt, most of the technical debt elements observed were related to bad architectural choices, followed by overly complex code and lack of code documentation.

Delving into the OutSystems world and how we manage Technical Debt
OutSystems has always set a high priority to architectural best practices. The layered canvas was the first big guideline, made available years ago, that aimed at creating a reference design to fit all purposes. It’s a way of splitting an Application’s components into 3 big blocks, front-end, business logic, and business-agnostic artifact.

For the veterans in the tech industry, it‘s nothing new, really. The concepts behind it have been out there for a while now, sometimes with different names or behind fancy methodologies. It’s the good old “divide and conquer” principle. You group your components into these categories, follow some key guidelines and you will have avoided some headache.
Then, several guiding principles came along the lines of addressing common problems through design patterns. You want to integrate your App with a white elephant legacy ERP and don’t want it to hang due to old-school heavy Apis? Use a cold cache integration pattern. Your client has 2 legacy systems that handle product catalogues? Adopt the transparency service pattern.
There are smart and comprehensive guides for all the common problems out there. They are all well documented and tested, trust me.


Where to look at?
Ok, but how to get started? There are a few tools you can rely on in order to accelerate your flow and plan to address the problem areas while adding new functionality. Discovery is a good first place to look at. It is a utility that has been the top-of-mind tool for any Tech Lead or Architect looking to have a sound architecture.
It provides you with colorful and crystalline diagrams that bring an Application’s actual blueprint to the surface and whatever doesn’t look good in it. There are a bunch of best practice rules that are validated and then exposed graphically should they be violated.

Bear in mind that OutSystems is looking at bringing more information into the Architecture Dashboard, which I’m gonna cover in the next few lines, reducing the dependencies on Discovery for Technical Debt Management.
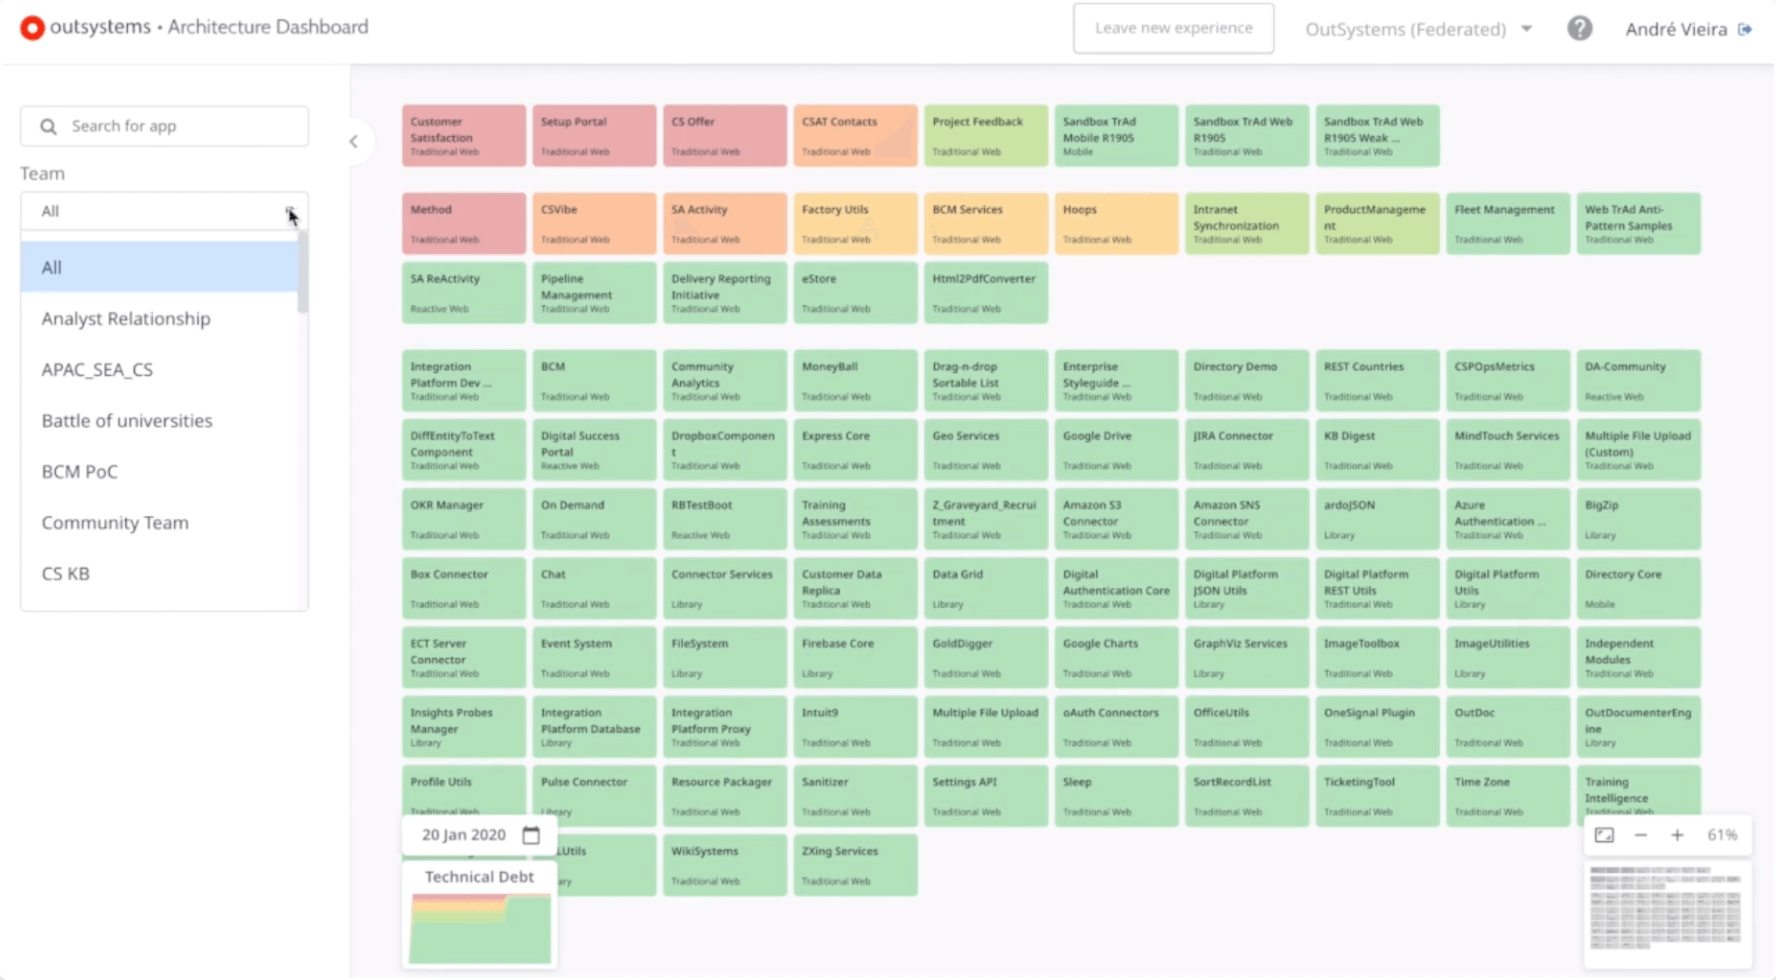
The most recent goodie out there is the Architecture Dashboard. It is a SaaS product that recently made its way to general availability and comes with lots of interesting “mind trick” kind of insights helping you, my dear Tech Lead, expedite your recurrent job of keeping the house in order.
However, even though it seems like these toys do some sort of magic, I felt like sharing some insights on how to put them all to work for you and help build your strategy to tackle the technical debt on your projects.
1. Build a clear prioritisation guideline for your team
I personally use 2 priority sets. One for the early phases of the project, when you don’t need to worry too much about cutover and go-live plans or production mode. And the other for projects that are already in production or about to go live.
Architecture and Maintainability first, then performance
Early-stage is when you want to put everything in its right place, so you avoid costs and headaches at the end. You should, for example, avoid finding out, when it’s too late, that an end-user module is providing services, or that you have a critical cyclic reference that would take days for a developer to refactor or that would potentially demand an undesired regression test.
Performance should be diligently reviewed. Most of the common performance issues I have experienced could have been avoided with appropriate care around good practices. For instance, updating site properties in the App logic, or large session variables. Any of these, if noticed too late, might demand a costly refactoring.
Security first, then performance
Some common mistakes are the main factors that drive insecure Apps. And you need to be diligent to make sure your team is avoiding them. Javascript and SQL injection can be easily avoided.
Now Architecture Dashboard gets really handy when you are monitoring a live App, as it leverages an integration with Lifetime Analytics to highlight findings related to trending issues out of real usage.
All in all, the key idea is: Get the house in order early, and be careful when in production mode.
2. Combine the tools to spice up the outcomes
Keeping an eye on Discovery regularly is really useful, as it helps you tackle findings before they become real problems. Architecture Dashboard should be visited quite often too. I use it on the recurrent technical review sessions I have with my teams to follow up on the technical debt trends.
It is important to keep your Applications and Modules classifications up to date in Discovery. Bear in mind that they can get outdated quite easily as it is common to have new modules added or their purpose changed throughout the development lifecycle.
Combining the power of both tools will help you build a heatmap view in your head of what areas you have to prioritise. Especially in big factories, when there is a fair amount of shared components across Apps owned by different sponsors or maintained by different teams. The coordination of task force efforts for regression testing, especially when involving multiple teams, is normally cumbersome. So better focus first on what is more important or trending.
3. Encourage the Devs to be diligent themselves too
Tech Leads should keep the habit of checking Architecture Dashboard at least once a week in order to keep a good track of the level of technical debt and its trends.
Although I strongly advise not to constraint it to Tech Leads only. Developers should consider Architecture Dashboard as their companion tool that helps them lean towards best practices, preferably on a daily basis.
Architects can visit regularly and preferably before the project goes live to assess the overall level of technical debt.
4. Have constant checkpoints with your team
I find the regular technical review sessions I conduct with my teams of the highest importance. It is when we raise collective understanding around the top priorities in the project. I found it worth giving the team the opportunity to see, for themselves, everything from a higher-level perspective and I always encourage them to see the bigger picture.
Give everyone access to the tools. The team needs time to digest things. We all need. And the tools are pretty intuitive and quite handy for this. You will notice that your teammates will stop habits that make the technical debt build-up and help you avoid going through the same findings over and over again.
5. Bring the client to the party
Of course, the client is the ultimate sponsor, therefore they need to be aware of the technical debt the project team is holding over. Besides, they need to have a say on the balance between new stories and technical debt items that the team should take into the Sprint.
But it is your job as a Tech Lead to influence and help both, the client and the team, keep this very special backlog under control. Abstracting a technical debt element and bringing it to a business context so it can be understood by non-tehnical clients is an art. I keep learning.
How about if you evidence the consequences of not addressing pending key issues timely? Bring the impacts you have observed to the table in a clear structured way. Have open conversations about it during the retrospective sessions.
6. Check your temperature regularly
Architecture Dashboard has a built-in color scheme that helps you understand and prioritise the Modules and Apps with more technical debt according to the severity of the findings and how hard they are to get fixed.
They are calculated based on algorithms that take several different aspects into consideration, including the feedback from a network of customers/partners that chipped in during the technical review (EAP) of the tool. It’s also based on well-known best practices. This algorithm is constantly being optimised to better address the most common aspects around architecture validation.

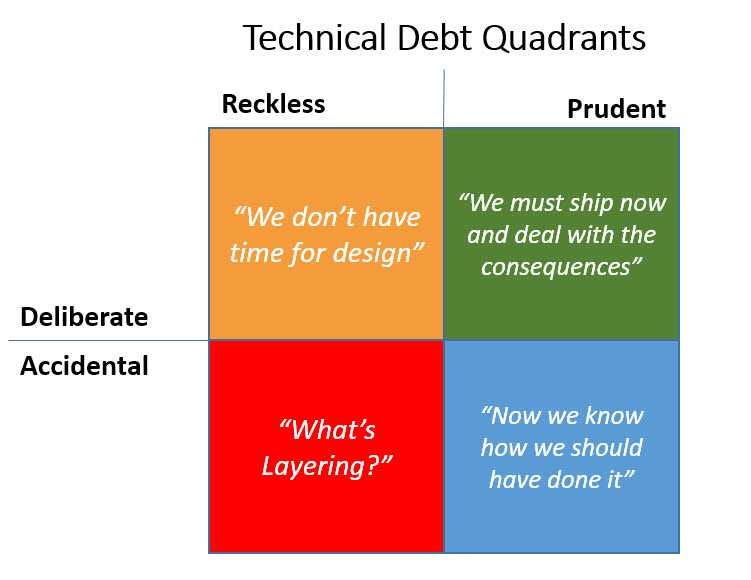
DevIQ has come up with an interesting approach to Martin Fowler’s original Technical Debt Quadrant, in which you measure the temperature of your decisions about technical debt. I see it as an interesting mechanism to have a finer idea of the maturity of your team.
The more red-ish the decisions you’ve been making are, the more grounded knowledge your team might be requiring. As opposed to if you are constantly staying in a green-ish area, perhaps it’s an indication that your team is getting senior enough to share the knowledge they got and start skilling up others.
7. Clean up and focus on what is important
As the Code Analysis runs in the Development Environment, it will include all the Apps currently there. So it’s worth it taking sandbox and test projects out of your sight.
You can configure the modules that you want to be ignored by the analysis. It will help you have a sharper view of your landscape.

8. Be honest
Architecture Dashboard can generate heaps of findings that can get a bit repetitive or even redundant. For instance, missing documentation on public elements with self-explanatory names, or missing max records on aggregates filtering records by a primary key. Although it’s necessary, it can be annoying, I know.
On another note, I’ve seen companies trying to create some sort of gamification approach to “encourage” development teams to use the tool in a consistent way. What happens is, if these systems are created on top of the wrong premises, people will game the system in order to tick a box and get back to their daily activities. Everyone has a project to deliver, correct?
“False positive” and “Won’t fix” features need to be used carefully so that you don’t fool yourself and your team. Bear in mind that these tools have the ultimate goal of helping you get better results. If it’s not delivering any value, you better review your process or the values you are trying to carve in your team.
9. Give back
Architecture Dashboard is in constant improvement, and the feedback provided by the community is paramount. Create Ideas on the Forum. Submit feedback from within the tool, or go to the official documentation pages. It is important to let the engineering team know what’s been working for you and what’s not. That’s how we can keep benefiting from it.
All in all, tools like Discovery and Architecture Dashboard have added tremendous value to a number of projects where they’ve been adopted. However, at the end of the day, it is more about the dynamics you instill rather than the tools, reports, or warnings. Maintaining a project healthy is a mix of preventative measures, the art of abstracting, and diligence.

Joao Melo
PhoenixDX Technical Lead
Connect with Joao on LinkedIn